Statistically Insignificant News
In "'Worrying' jobless rise needs urgent action - Labour" the BBC reported...
The number of people out of work rose by 38,000 to 2.49 million in the three months to June, official figures show.
Sounds scary doesn't it? All doom and gloom. That is until you look into the official figures for August 2011 (pdf) provided by the Office for National Statistics.
The 38,000 figure comes from page 13 of the PDF...
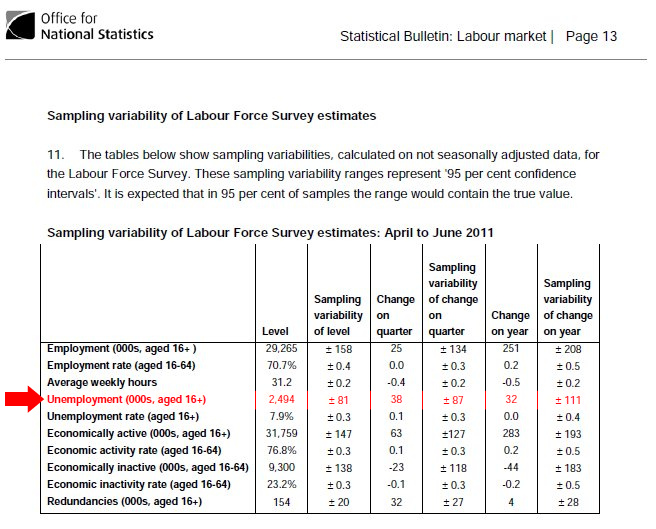
Note the paragraph above the table and the ± in the columns marked "Sampling variability of change on...". The BBC don't mention this in their report. Why not? Well because it turns this "news" into "non-news".
So how can these seemingly insignificant bits of information turn these figures into nothing? Well, it's all about sampling. Naturally, it's impossible to survey the entire country, so only a small percent of the population is surveyed. Now this in itself could be unrepresentative in two ways: 1) you could get just downright stupid sampling, like trying to determine the overall unemployment rate of the nation by asking people walking into the Job Centre in a town full of children and OAPs, or 2) by pure chance and thus you get what is called a sampling error.
Now to try and account for this, statisticians include a "confidence interval" (ie a margin of error) in the data they present and a confidence level, commonly something like 95%. So what does this mean? Strictly this means that if you repeatedly took samples of a set size, then on 95% of those samples, the true result of what you are trying to measure would lie somewhere between the upper and lower limits of the confidence interval (c) of your samples, ie take my calculated guess (x) and create an interval that spans x-c to x+c... you'll find the actual figure somewhere in that range.
In the case of this report, the estimated change over the last quarter is 38,000. Sounds a lot, but consider the 95% confidence value for a confidence interval for the quarter of ±87,000. This means that the actual change is somewhere between -49,000 (ie a decrease in unemployment) and 125,000, including 0, which is no change at all.
This huge range effectively says unemployment could have gone up, remained unchanged or decreased. Well that's not really useful at all and I believe these results are technically statistically insignificant. Now statistical insignificance doesn't always mean unimportant, however by just looking at these figures we can see this really shouldn't have received the attention they got.
I can't help but think this may be reporting statistics for the sake of reporting statistics and only leads to confusion and the media over-hyping nothing. The ONS figures mathematically would have had the same impact if they'd just said "no change" or "we don't know".
Of course this doesn't make news, so reporters will continue to ignore little facts like this and leave it up to the reader to investigate things further for themselves.